
Industries
Food & Beverage Processing
Connect water and energy use to cleaning, production yield and process performance.
CIP systems, pasteurizers, chillers and washdown processes often run on schedules established years ago. They can consume water and energy whether production is active or not, while a monthly bill provides no way to separate one load from another. Permanent submetering makes those schedules visible so your team can adjust them and verify the result—often with little or no capital spending.
Meters on the incoming main, CIP skid and washdown lines show where each shift’s water goes. Because many CIP recipes rely on fixed timers, a rinse may continue after it has achieved its purpose. Measuring litres per cycle and per circuit helps sanitation teams identify extended rinses, leaking return valves and the circuits worth investigating first.
The same principle applies across the facility. Pasteurizer water may continue flowing between runs, condenser fouling can raise refrigeration head pressure at the same load, and a cold room can drift overnight. A monthly bill combines these events into one total; interval data separates them by time, process and cause.
Your Scope 1 and Scope 2 emissions may form part of your customers’ Scope 3 inventories, which is why requests for measured energy data keep increasing. The same measurement approach supports a facility water balance: compare each source with known end uses and quantify what remains unaccounted for. Because the balance is built from permanent meters, it can be updated continuously instead of becoming a one-time report.
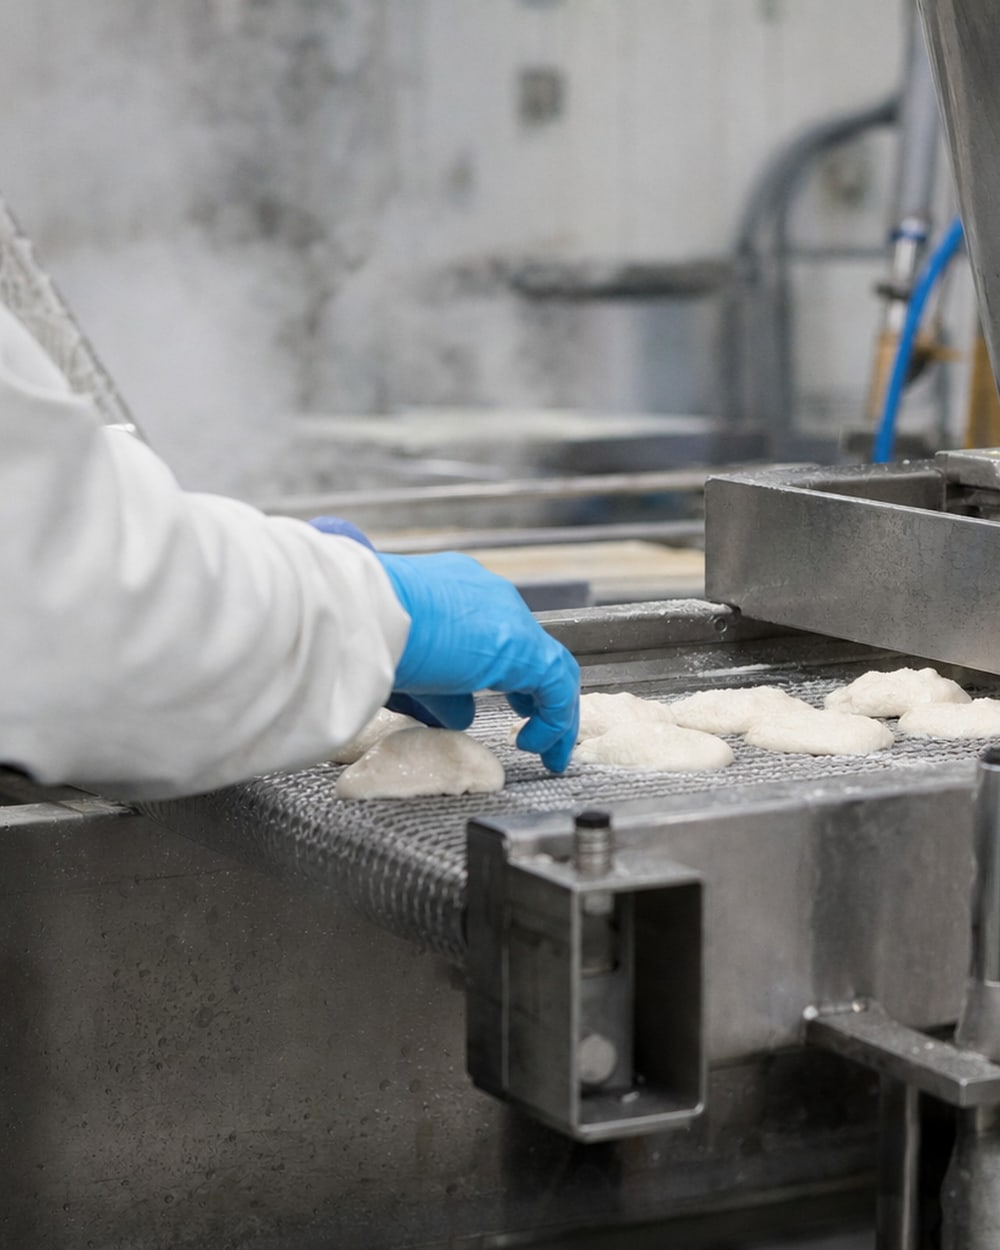
What we typically measure in this sector.
Nine monitoring categories appear repeatedly across our projects. The items below are the ones most relevant to this sector, with links to examples of what each has revealed.
- 01
Water
At typical industrial water and sewer rates, a continuous 10 L/min leak can cost more than $15,000 per year.
Submetering helps isolate the source, and monthly reviews keep the corrective action moving.
- 02
Electricity
Demand charges can represent 30–40% of an industrial electricity bill.
Interval data shows when peaks occur and whether load shifting, peak shaving, or rescheduling offers the best return.
- 03
Natural Gas
Unnoticed operational changes quietly inflate heating bills 10–20%.
A monthly bill hides the cause; interval data shows when the baseload begins to rise.
- 04
Compressed Air
Leaks silently consume 20–30% of compressor output.
Continuous flow and pressure monitoring shows the leak load, helping your team prioritize repairs and verify the savings.
- 08
Temperature & Humidity
A manual 6 a.m. round takes time and captures only one moment.
Continuous monitoring records temperature, humidity and humidex around the clock — and lets you check them from your desk, phone, or lunchroom TV.
- 09
Process Monitoring
Operator experience identifies the question. Process data gives the team evidence to act on.
Track cycle counts, runtime, firing rate, and product temperature—the operating details a utility bill cannot show.
What the data looks like.
Representative operational data, not a client result. The shapes are real; the factory is not.
| Interval | CIP supply (L/min) |
|---|---|
| 00:00 | 59 |
| 00:30 | 54 |
| 01:00 | 50 |
| 01:30 | 418 |
| 02:00 | 407 |
| 02:30 | 183 |
| 03:00 | 186 |
| 03:30 | 98 |
| 04:00 | 96 |
| 04:30 | 523 |
| 05:00 | 506 |
| 05:30 | 506 |
| 06:00 | 144 |
| 06:30 | 150 |
| 07:00 | 146 |
| 07:30 | 146 |
| 08:00 | 157 |
| 08:30 | 144 |
| 09:00 | 154 |
| 09:30 | 152 |
| 10:00 | 139 |
| 10:30 | 150 |
| 11:00 | 150 |
| 11:30 | 147 |
| 12:00 | 144 |
| 12:30 | 141 |
| 13:00 | 364 |
| 13:30 | 357 |
| 14:00 | 156 |
| 14:30 | 160 |
| 15:00 | 159 |
| 15:30 | 143 |
| 16:00 | 144 |
| 16:30 | 156 |
| 17:00 | 149 |
| 17:30 | 156 |
| 18:00 | 157 |
| 18:30 | 148 |
| 19:00 | 158 |
| 19:30 | 161 |
| 20:00 | 150 |
| 20:30 | 150 |
| 21:00 | 55 |
| 21:30 | 66 |
| 22:00 | 64 |
| 22:30 | 69 |
| 23:00 | 58 |
| 23:30 | 70 |
What it found in factories like yours.
water
Sub-metering a brewery, and taking more than 100,000 m³ off its water use
Carlsberg Canada
Between 2023 and 2024 water use at the Carlsberg Canada brewery fell by more than 100,000 m³, and the Region of Waterloo gave the site its 2024 Water Efficiency Excellence Award for it.
compressed-air · water
More than $150,000 a year, taken out on the dashboard data
PDI Bulk
Metering PDI Bulk's water and compressed air showed where both were going, and within weeks the general manager had taken more than $150,000 a year out of operating costs on process adjustments alone.
Illustrative scenario
temperature-humidity
A cold-storage alert at two in the morning
A cold storage operation
An overnight refrigeration fault was detected before product temperature was affected.
Illustrative scenario
cooling-towers · energy
Refrigeration condenser fouling detection
A food storage and processing site
Head pressure rose while refrigeration load remained constant, revealing condenser fouling and quantifying its energy cost.
Book a site walk.
We spend a few hours on your floor with the people who run it, and by the end of that walk we can tell you what we saw, what we would meter first, and roughly what it is worth.
or call 1-833-QUANTFY (1-833-782-6839)