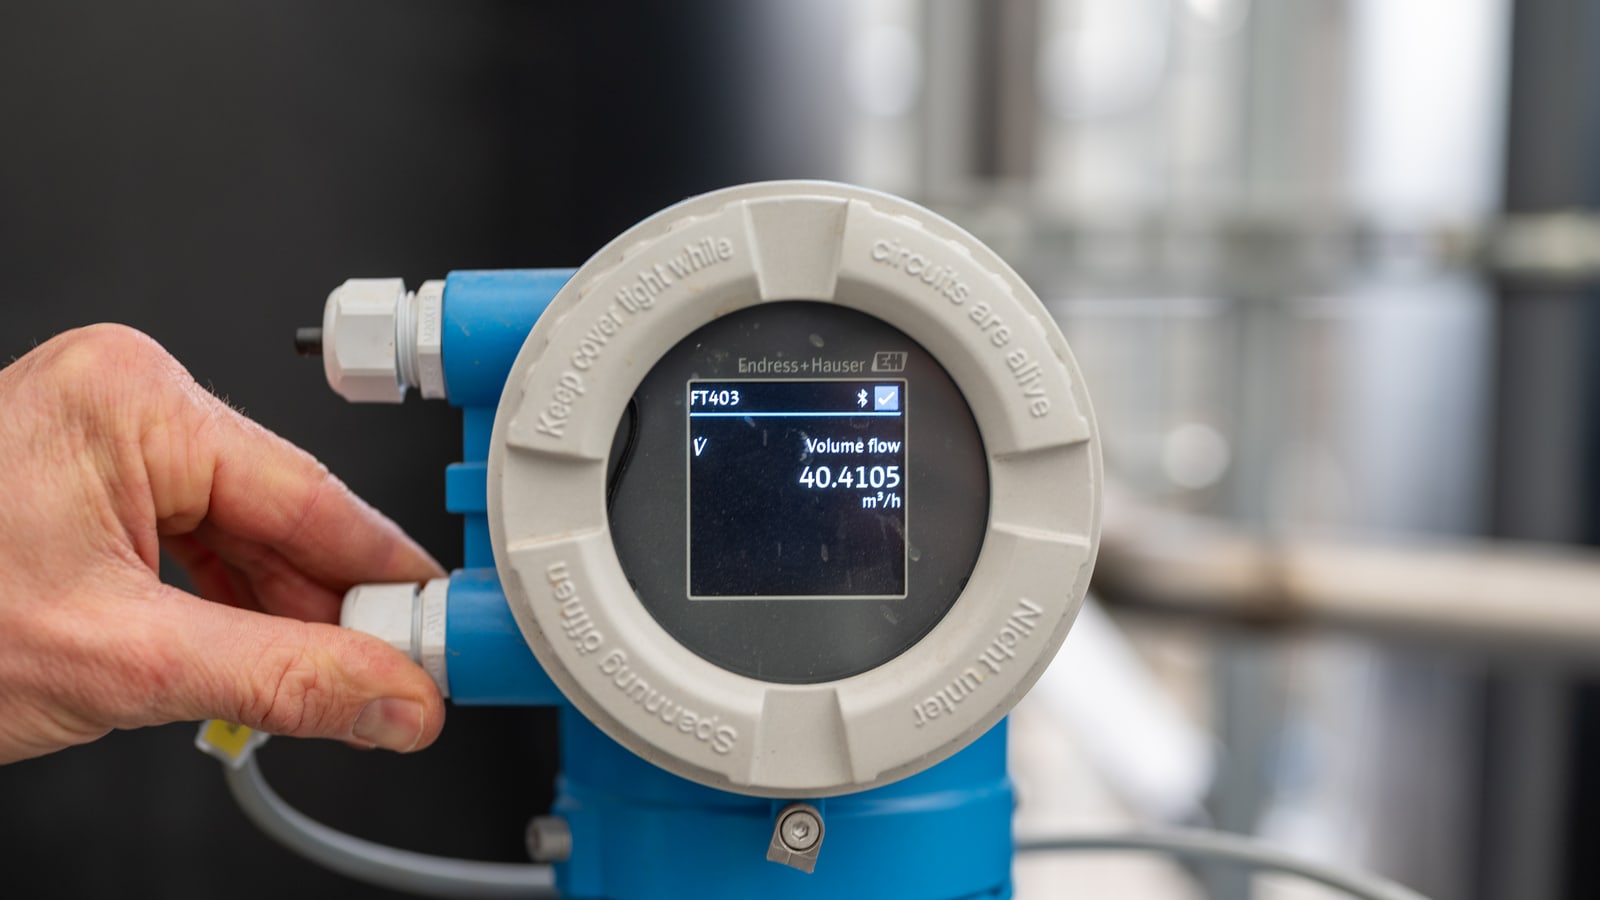
Quantify Environmental installs permanent wireless sensors throughout your facility and brings all your data into one clear, real-time dashboard. After installation, we keep working with your team to find savings, solve problems, and improve day-to-day operations.
An Energy Management Information System (EMIS) combines continuous utility (water, electricity, natural gas, and compressed air), equipment, and environmental data in a single interface, allowing your team to identify changes as they occur.
Explore the demo dashboard below: choose a utility, inspect a reading, or expand any panel.
Example period
The tabs, example period, motion and expand controls need JavaScript. Every panel below is server-rendered and complete for the default range, and without script they simply stack.
Site time America/Toronto · Wed 5 Aug 2026 23:30:00 Readings refresh every 30 s · Last reading Wed 5 Aug 2026 23:30:00
Water main
Flow rate (L/min)
Overnight flow continues
No data
Sample day · Wed 5 Aug 2026 · 30-minute means
Chart data
Interval
City main (L/min)
00:00
87
00:30
85
01:00
90
01:30
89
02:00
89
02:30
77
03:00
81
03:30
90
04:00
84
04:30
80
05:00
129
05:30
186
06:00
221
06:30
224
07:00
228
07:30
230
08:00
227
08:30
230
09:00
233
09:30
220
10:00
228
10:30
222
11:00
229
11:30
232
12:00
173
12:30
173
13:00
309
13:30
310
14:00
311
14:30
305
15:00
311
15:30
242
16:00
251
16:30
248
17:00
241
17:30
241
18:00
240
18:30
240
19:00
242
19:30
248
20:00
250
20:30
250
21:00
246
21:30
237
22:00
112
22:30
104
23:00
114
23:30
104
Interpret this chart
What changed:Water continues to flow overnight.
Why it matters:Off-hours demand adds to the daily intake even when the lines are idle.
What to check:Check the cleaning schedule, cooling demand and valve positions.
Next step:Isolate unexplained draws, then compare the overnight floor.
Effluent meter
Daily intake and effluent (m³)
Reconcile intake and effluent
No data
9 Jul 2026 to 5 Aug 2026 · Daily totals · Check meter timing and other outlets
Chart data
Interval
City main in (m³)
Effluent out (m³)
9 Jul 2026
282
229
10 Jul 2026
280
218
11 Jul 2026
215
170
12 Jul 2026
160
127
13 Jul 2026
280
224
14 Jul 2026
282
225
15 Jul 2026
282
225
16 Jul 2026
282
222
17 Jul 2026
280
223
18 Jul 2026
214
175
19 Jul 2026
160
125
20 Jul 2026
278
217
21 Jul 2026
282
223
22 Jul 2026
282
228
23 Jul 2026
281
225
24 Jul 2026
282
224
25 Jul 2026
214
167
26 Jul 2026
159
126
27 Jul 2026
281
229
28 Jul 2026
281
230
29 Jul 2026
279
222
30 Jul 2026
280
227
31 Jul 2026
281
228
1 Aug 2026
215
175
2 Aug 2026
159
126
3 Aug 2026
280
224
4 Aug 2026
281
221
5 Aug 2026
282
226
Hour by day
Select a cell to inspect its day
7 day heatmap (m³)
Afternoon cleaning draws repeat
No data
Tap or arrow through a cell to inspect it.
30 Jul 2026 to 5 Aug 2026 · Hourly totals (m³) · SCALE P5–P955.018 m³
Matrix data
Day
00
01
02
03
04
05
06
07
08
09
10
11
12
13
14
15
16
17
18
19
20
21
22
23
Thu
5
5
5
5
5
9
13
14
14
13
14
14
10
18
19
17
14
14
14
14
15
14
7
6
Fri
5
5
5
5
5
10
14
14
14
14
14
14
10
18
18
16
14
15
15
14
15
14
7
7
Sat
5
5
5
5
5
8
10
10
10
10
10
10
8
13
13
12
11
11
11
11
11
11
6
6
Sun
5
5
5
5
5
6
7
7
7
7
7
7
6
8
8
8
7
7
7
7
7
7
5
5
Mon
5
5
5
5
5
10
13
14
14
14
14
14
10
19
19
16
14
15
15
14
14
15
6
6
Tue
5
5
5
5
5
10
14
14
14
14
14
13
11
18
18
16
15
15
15
15
15
15
6
7
Wed
5
5
5
5
5
9
13
14
14
14
13
14
10
19
18
17
15
14
14
15
15
14
6
7
Daily use
Daily consumption (m³)
Base load remains on weekends
No data
7 Jul 2026 to 5 Aug 2026 · Daily totals
Chart data
Interval
Value (m³)
7 Jul 2026
281
8 Jul 2026
280
9 Jul 2026
282
10 Jul 2026
280
11 Jul 2026
215
12 Jul 2026
160
13 Jul 2026
280
14 Jul 2026
282
15 Jul 2026
282
16 Jul 2026
282
17 Jul 2026
280
18 Jul 2026
214
19 Jul 2026
160
20 Jul 2026
278
21 Jul 2026
282
22 Jul 2026
282
23 Jul 2026
281
24 Jul 2026
282
25 Jul 2026
214
26 Jul 2026
159
27 Jul 2026
281
28 Jul 2026
281
29 Jul 2026
279
30 Jul 2026
280
31 Jul 2026
281
1 Aug 2026
215
2 Aug 2026
159
3 Aug 2026
280
4 Aug 2026
281
5 Aug 2026
282
Sankey diagram
Sources to end uses (L/min)
Unaccounted: 16 L/min
No data
Sample day · Wed 5 Aug 2026 · Mean flow (L/min) · Shares of total source flow
Flow data
From
To
Value (L/min)
City main
CIP · Lines 1 to 3
69
City main
Pasteurizer
44
City main
Sanitation washdown
34
Well W-2
Boiler feed
33
City main
Cooling tower makeup
32
Recovered CIP rinse
CIP · Lines 1 to 3
26
Well W-2
Cooling tower makeup
22
City main
Unaccounted
16
Recovered CIP rinse
Sanitation washdown
13
Main incomer
Demand (kW)
Peak 99 kW · check equipment starts
No data
Sample day · Wed 5 Aug 2026 · 30-minute means
Chart data
Interval
Main incomer (kW)
00:00
43
00:30
42
01:00
41
01:30
42
02:00
41
02:30
40
03:00
42
03:30
43
04:00
42
04:30
42
05:00
42
05:30
52
06:00
60
06:30
69
07:00
71
07:30
71
08:00
69
08:30
70
09:00
71
09:30
71
10:00
70
10:30
71
11:00
71
11:30
70
12:00
70
12:30
63
13:00
62
13:30
72
14:00
99
14:30
85
15:00
65
15:30
65
16:00
66
16:30
67
17:00
65
17:30
66
18:00
65
18:30
65
19:00
67
19:30
67
20:00
67
20:30
66
21:00
66
21:30
65
22:00
45
22:30
47
23:00
46
23:30
46
Interpret this chart
What changed:The incomer reaches its highest half-hour demand during the day shift.
Why it matters:Equipment that starts together can raise the peak used in a billing interval.
What to check:Check equipment start times against the tariff billing interval.
Next step:Test a staggered start that still meets production requirements.
Power factor
At the incomerAt threshold
0.90 · threshold 0.90
No data
Sample day · Wed 5 Aug 2026 · Last reading 23:30 · Ratio
Reading
Value
0.90
Scale
0.7–1.0
Limit
0.9
Daily energy
Daily consumption (kWh)
Weekend energy falls
No data
7 Jul 2026 to 5 Aug 2026 · Daily totals
Chart data
Interval
Value (kWh)
7 Jul 2026
5,908
8 Jul 2026
5,901
9 Jul 2026
5,903
10 Jul 2026
5,910
11 Jul 2026
5,133
12 Jul 2026
4,493
13 Jul 2026
5,903
14 Jul 2026
5,878
15 Jul 2026
5,929
16 Jul 2026
5,928
17 Jul 2026
5,911
18 Jul 2026
5,107
19 Jul 2026
4,502
20 Jul 2026
5,909
21 Jul 2026
5,914
22 Jul 2026
5,899
23 Jul 2026
5,906
24 Jul 2026
5,906
25 Jul 2026
5,126
26 Jul 2026
4,498
27 Jul 2026
5,915
28 Jul 2026
5,862
29 Jul 2026
5,894
30 Jul 2026
5,899
31 Jul 2026
5,893
1 Aug 2026
1,258
2 Aug 2026
1,105
3 Aug 2026
1,454
4 Aug 2026
1,451
5 Aug 2026
1,451
Monthly energy
Monthly consumption (MWh)
Compare summer and shutdown loads
No data
1 Aug 2025 to 31 Jul 2026 · Twelve completed months
Chart data
Interval
Value (MWh)
Aug 2025
120
Sep 2025
160
Oct 2025
152
Nov 2025
134
Dec 2025
132
Jan 2026
128
Feb 2026
119
Mar 2026
139
Apr 2026
146
May 2026
161
Jun 2026
165
Jul 2026
174
Daily electricity across 52 weeks
Select a cell to inspect its weekday
Day by week (kWh)
Setback began 8 Sep 2025
No data
Tap or arrow through a cell to inspect it.
4 Aug 2025 to 2 Aug 2026 · 52 completed weeks · Columns start Monday · SCALE P5–P953,4045,924 kWh
Matrix data
Day
4 Aug 2025
11 Aug 2025
18 Aug 2025
25 Aug 2025
1 Sep 2025
8 Sep 2025
15 Sep 2025
22 Sep 2025
29 Sep 2025
6 Oct 2025
13 Oct 2025
20 Oct 2025
27 Oct 2025
3 Nov 2025
10 Nov 2025
17 Nov 2025
24 Nov 2025
1 Dec 2025
8 Dec 2025
15 Dec 2025
22 Dec 2025
29 Dec 2025
5 Jan 2026
12 Jan 2026
19 Jan 2026
26 Jan 2026
2 Feb 2026
9 Feb 2026
16 Feb 2026
23 Feb 2026
2 Mar 2026
9 Mar 2026
16 Mar 2026
23 Mar 2026
30 Mar 2026
6 Apr 2026
13 Apr 2026
20 Apr 2026
27 Apr 2026
4 May 2026
11 May 2026
18 May 2026
25 May 2026
1 Jun 2026
8 Jun 2026
15 Jun 2026
22 Jun 2026
29 Jun 2026
6 Jul 2026
13 Jul 2026
20 Jul 2026
27 Jul 2026
MON
1,562
1,562
6,264
6,233
5,939
5,525
5,512
5,519
5,510
5,153
5,126
5,126
5,148
4,745
4,748
4,748
4,760
4,457
4,465
4,468
4,469
4,485
4,359
4,366
4,368
4,351
4,450
4,484
4,482
4,452
4,743
4,741
4,749
4,755
4,755
5,134
5,123
5,113
5,144
5,499
5,541
5,530
5,531
5,813
5,809
5,795
5,804
5,756
5,903
5,903
5,909
5,915
TUE
1,555
1,561
6,238
6,240
5,944
5,522
5,543
5,505
5,539
5,141
5,129
5,126
5,135
4,750
4,763
4,732
4,745
4,459
4,478
4,461
4,470
4,469
4,373
4,354
4,376
4,357
4,480
4,475
4,466
4,458
4,755
4,733
4,747
4,736
4,758
5,142
5,138
5,141
5,123
5,522
5,518
5,535
5,518
5,806
5,804
5,798
5,803
5,809
5,908
5,878
5,914
5,862
WED
1,555
1,559
6,222
6,235
5,936
5,517
5,507
5,540
5,135
5,152
5,132
5,139
5,132
4,745
4,756
4,746
4,734
4,469
4,480
4,475
4,454
4,473
4,356
4,358
4,383
4,351
4,473
4,475
4,448
4,461
4,760
4,755
4,750
4,768
5,124
5,153
5,129
5,130
5,150
5,534
5,513
5,509
5,519
5,808
5,789
5,805
5,788
5,925
5,901
5,929
5,899
5,894
THU
1,562
1,564
6,225
6,218
5,928
5,536
5,511
5,520
5,131
5,139
5,158
5,139
5,134
4,732
4,757
4,753
4,771
4,472
4,467
4,481
4,466
4,350
4,368
4,356
4,355
4,366
4,447
4,468
4,477
4,470
4,733
4,735
4,748
4,745
5,131
5,127
5,145
5,131
5,122
5,522
5,538
5,514
5,514
5,793
5,818
5,793
5,786
5,886
5,903
5,928
5,906
5,899
FRI
1,561
6,218
6,252
6,238
5,938
5,542
5,514
5,526
5,121
5,124
5,125
5,127
5,141
4,749
4,744
4,749
4,758
4,470
4,465
4,489
4,461
4,376
4,364
4,365
4,371
4,368
4,465
4,465
4,476
4,481
4,770
4,735
4,748
4,751
5,124
5,112
5,147
5,127
5,540
5,508
5,509
5,531
5,510
5,806
5,806
5,816
5,795
5,899
5,910
5,911
5,906
5,893
SAT
1,356
5,411
5,426
5,416
5,154
4,790
4,808
4,786
4,450
4,470
4,464
4,455
4,131
4,127
4,128
4,127
4,118
3,884
3,879
3,878
3,883
3,781
3,781
3,796
3,792
3,793
3,888
3,890
3,885
3,886
4,116
4,119
4,128
4,122
4,465
4,457
4,458
4,457
4,796
4,801
4,791
4,798
4,788
5,036
5,041
5,039
5,040
5,115
5,133
5,107
5,126
1,258
SUN
1,188
4,752
4,760
4,753
4,521
4,206
4,208
4,202
3,911
3,911
3,913
3,910
3,616
3,616
3,622
3,621
3,621
3,404
3,404
3,407
3,404
3,325
3,324
3,330
3,327
3,408
3,406
3,406
3,407
3,618
3,621
3,617
3,616
3,622
3,912
3,916
3,911
3,907
4,208
4,206
4,207
4,198
4,204
4,418
4,418
4,417
4,422
4,500
4,493
4,502
4,498
1,105
Boilers 1 and 2
Flow to boilers (Nm³/h)
Morning boiler fire-up
No data
Sample day · Wed 5 Aug 2026 · 30-minute means
Chart data
Interval
Boiler feed (Nm³/h)
00:00
4.5
00:30
5.5
01:00
4.9
01:30
5.7
02:00
4.3
02:30
4.9
03:00
5.5
03:30
5.8
04:00
5.4
04:30
10
05:00
16
05:30
20
06:00
19
06:30
19
07:00
21
07:30
21
08:00
21
08:30
20
09:00
19
09:30
21
10:00
21
10:30
20
11:00
21
11:30
21
12:00
20
12:30
20
13:00
25
13:30
26
14:00
25
14:30
26
15:00
26
15:30
18
16:00
18
16:30
18
17:00
19
17:30
18
18:00
19
18:30
18
19:00
19
19:30
18
20:00
19
20:30
19
21:00
18
21:30
19
22:00
6.4
22:30
7.3
23:00
7.6
23:30
6.9
Bottle pasteurizer
Steam flow (lb/h)
Check overnight holding demand
No data
Sample day · Wed 5 Aug 2026 · 30-minute means
Chart data
Interval
Steam flow (lb/h)
00:00
254
00:30
223
01:00
230
01:30
247
02:00
262
02:30
230
03:00
277
03:30
284
04:00
242
04:30
255
05:00
249
05:30
706
06:00
1,182
06:30
1,723
07:00
1,688
07:30
1,705
08:00
1,714
08:30
1,710
09:00
1,644
09:30
1,706
10:00
1,639
10:30
1,701
11:00
1,719
11:30
1,686
12:00
1,635
12:30
1,139
13:00
1,139
13:30
1,596
14:00
1,586
14:30
1,592
15:00
1,666
15:30
1,591
16:00
1,620
16:30
1,600
17:00
1,636
17:30
1,596
18:00
1,617
18:30
1,621
19:00
1,632
19:30
1,576
20:00
1,596
20:30
1,596
21:00
1,576
21:30
387
22:00
344
22:30
361
23:00
326
23:30
343
Interpret this chart
What changed:Steam continues to flow outside the main production shift.
Why it matters:Holding temperature can require steam even when the pasteurizer is not producing.
What to check:Check the holding requirements and steam valve positions.
Next step:Confirm the permitted standby condition with operations.
Daily gas use
Daily consumption (Nm³)
Weekend demand remains
No data
7 Jul 2026 to 5 Aug 2026 · Daily totals
Chart data
Interval
Value (Nm³)
7 Jul 2026
502
8 Jul 2026
500
9 Jul 2026
501
10 Jul 2026
504
11 Jul 2026
357
12 Jul 2026
241
13 Jul 2026
505
14 Jul 2026
500
15 Jul 2026
505
16 Jul 2026
505
17 Jul 2026
507
18 Jul 2026
357
19 Jul 2026
241
20 Jul 2026
504
21 Jul 2026
501
22 Jul 2026
500
23 Jul 2026
503
24 Jul 2026
502
25 Jul 2026
359
26 Jul 2026
241
27 Jul 2026
505
28 Jul 2026
501
29 Jul 2026
504
30 Jul 2026
506
31 Jul 2026
511
1 Aug 2026
275
2 Aug 2026
184
3 Aug 2026
385
4 Aug 2026
385
5 Aug 2026
386
Monthly gas use
Monthly consumption (Nm³)
Compare seasonal gas demand
No data
1 Aug 2025 to 31 Jul 2026 · Twelve completed months
Chart data
Interval
Value (Nm³)
Aug 2025
10,377
Sep 2025
15,700
Oct 2025
22,349
Nov 2025
29,450
Dec 2025
39,457
Jan 2026
40,794
Feb 2026
34,929
Mar 2026
31,895
Apr 2026
22,526
May 2026
17,274
Jun 2026
14,229
Jul 2026
13,966
Air header
Header flow (L/s)
Check essential users and leakage
No data
Sample day · Wed 5 Aug 2026 · 30-minute means
Chart data
Interval
Header flow (L/s)
00:00
66
00:30
66
01:00
65
01:30
61
02:00
63
02:30
62
03:00
59
03:30
62
04:00
60
04:30
64
05:00
59
05:30
102
06:00
138
06:30
187
07:00
185
07:30
183
08:00
186
08:30
181
09:00
184
09:30
186
10:00
187
10:30
180
11:00
188
11:30
182
12:00
186
12:30
149
13:00
149
13:30
180
14:00
179
14:30
175
15:00
177
15:30
174
16:00
178
16:30
174
17:00
173
17:30
180
18:00
179
18:30
177
19:00
177
19:30
174
20:00
173
20:30
177
21:00
172
21:30
178
22:00
73
22:30
72
23:00
77
23:30
71
Interpret this chart
What changed:The air header still carries flow overnight.
Why it matters:The compressor must supply both essential users and any avoidable demand.
What to check:Check essential users, open blow-offs and leaks during the idle period.
Next step:Measure compressor power again after addressing avoidable demand.
Header pressure
Header pressure (bar)Within band
Within 6.2 to 7.0 bar
No data
Sample day · Wed 5 Aug 2026 · Last reading 23:30 · Operating band 6.2 to 7.0 bar
Reading
Value
6.4 bar
Scale
0.0–10.0 bar
Limit
7.0 bar
Compressor 1
Daily loaded hours (h)
Loaded hours persist on weekends
No data
23 Jul 2026 to 5 Aug 2026 · Hours under load
Chart data
Interval
Value (h)
23 Jul 2026
15
24 Jul 2026
15
25 Jul 2026
11
26 Jul 2026
7.9
27 Jul 2026
15
28 Jul 2026
15
29 Jul 2026
15
30 Jul 2026
15
31 Jul 2026
15
1 Aug 2026
11
2 Aug 2026
8.0
3 Aug 2026
16
4 Aug 2026
15
5 Aug 2026
15
Monthly compressor energy
Monthly consumption (kWh)
Compare compressor energy by month
No data
1 Aug 2025 to 31 Jul 2026 · Twelve completed months
Chart data
Interval
Value (kWh)
Aug 2025
15,858
Sep 2025
21,919
Oct 2025
21,032
Nov 2025
20,668
Dec 2025
21,372
Jan 2026
20,613
Feb 2026
19,822
Mar 2026
22,647
Apr 2026
20,565
May 2026
22,998
Jun 2026
22,470
Jul 2026
24,150
Silo levels
Six silos (% full)
Silo 3 is below reorder
No data
Sample day · Wed 5 Aug 2026 · Closing levels · Reorder at 25%
Chart data
Interval
Level (%)
S1 Flour A
37
S2 Flour B
57
S3 Sugar
23
S4 Starch
54
S5 Salt
88
S6 Whey
34
Interpret this chart
What changed:Silo 3 is 23% full, below the reorder level.
Why it matters:Low inventory leaves less time to respond before production needs replenishment.
What to check:Check the confirmed delivery time against planned production.
Next step:Confirm that the next delivery arrives before the expected draw uses the remaining stock.
Daily draw
Silo 3 · sugar (kg)
Sugar draw follows production
No data
23 Jul 2026 to 5 Aug 2026 · Sugar drawn (kg)
Chart data
Interval
Value (kg)
23 Jul 2026
2,905
24 Jul 2026
3,292
25 Jul 2026
1,795
26 Jul 2026
939
27 Jul 2026
2,849
28 Jul 2026
2,917
29 Jul 2026
2,860
30 Jul 2026
2,878
31 Jul 2026
3,079
1 Aug 2026
1,754
2 Aug 2026
875
3 Aug 2026
3,025
4 Aug 2026
3,247
5 Aug 2026
3,005
Inventory on hand
Silos 1 and 3 (kg)
Deliveries restore inventory
No data
7 Jul 2026 to 5 Aug 2026 · Closing inventory · Steps up are deliveries
Chart data
Interval
Silo 1 · flour (kg)
Silo 3 · sugar (kg)
7 Jul 2026
13,710
17,601
8 Jul 2026
9,360
14,379
9 Jul 2026
40,066
11,198
10 Jul 2026
35,958
8,155
11 Jul 2026
33,405
6,264
12 Jul 2026
32,190
5,364
13 Jul 2026
28,266
27,457
14 Jul 2026
24,085
24,360
15 Jul 2026
20,156
21,450
16 Jul 2026
16,329
18,615
17 Jul 2026
12,511
15,787
18 Jul 2026
10,169
14,052
19 Jul 2026
9,013
13,196
20 Jul 2026
39,920
10,164
21 Jul 2026
35,505
6,894
22 Jul 2026
31,528
28,948
23 Jul 2026
27,606
26,043
24 Jul 2026
23,162
22,751
25 Jul 2026
20,739
20,956
26 Jul 2026
19,471
20,017
27 Jul 2026
15,625
17,168
28 Jul 2026
11,687
14,251
29 Jul 2026
7,826
11,391
30 Jul 2026
38,941
8,513
31 Jul 2026
34,784
5,434
1 Aug 2026
32,416
28,680
2 Aug 2026
31,235
27,805
3 Aug 2026
27,151
24,780
4 Aug 2026
22,768
21,533
5 Aug 2026
18,711
18,528
Production areas
Three areas (°C)
Packaging runs warmer
No data
Sample day · Wed 5 Aug 2026 · 30-minute means
Chart data
Interval
Filling hall (°C)
Packaging (°C)
Shipping (°C)
00:00
21.6
23.6
18.7
00:30
21.6
23.7
18.7
01:00
21.2
23.8
18.4
01:30
21.6
24.0
18.5
02:00
21.3
23.9
18.5
02:30
21.6
24.0
18.4
03:00
21.4
23.7
18.6
03:30
21.2
23.9
18.7
04:00
21.6
23.9
18.5
04:30
21.3
23.9
18.4
05:00
21.6
23.9
18.4
05:30
21.4
24.0
18.8
06:00
23.0
24.5
17.1
06:30
22.9
24.1
16.6
07:00
22.6
24.0
16.2
07:30
22.4
23.7
15.9
08:00
22.0
23.1
16.1
08:30
22.2
23.0
15.5
09:00
21.7
22.9
15.4
09:30
21.6
22.6
15.7
10:00
21.4
22.1
15.6
10:30
20.9
22.1
15.6
11:00
21.0
22.0
15.8
11:30
20.8
21.7
15.6
12:00
20.8
21.8
16.1
12:30
20.2
21.8
16.2
13:00
20.2
21.4
16.2
13:30
20.0
21.8
16.9
14:00
20.0
21.7
16.9
14:30
20.1
21.7
17.2
15:00
19.7
22.0
18.0
15:30
20.0
22.3
18.0
16:00
19.6
22.2
18.7
16:30
19.6
22.6
18.9
17:00
20.1
22.5
19.2
17:30
19.7
22.9
19.8
18:00
20.1
23.1
20.4
18:30
19.9
23.3
20.4
19:00
20.2
23.9
20.6
19:30
20.4
24.2
20.8
20:00
20.4
24.4
21.1
20:30
20.7
24.6
21.3
21:00
21.1
24.7
21.8
21:30
21.3
25.3
21.9
22:00
21.5
23.9
18.5
22:30
21.3
23.7
18.8
23:00
21.3
23.6
18.7
23:30
21.3
23.7
18.6
Cold room 2
Dry bulb (°C)
Excursion above 6 °C
No data
Sample day · Wed 5 Aug 2026 · 30-minute means · Midday gap excluded from assessment
Chart data
Interval
Cold room 2 (°C)
00:00
3.4
00:30
2.9
01:00
2.9
01:30
3.0
02:00
2.9
02:30
3.1
03:00
3.4
03:30
3.0
04:00
4.9
04:30
6.3
05:00
5.1
05:30
2.9
06:00
3.3
06:30
3.5
07:00
3.5
07:30
2.9
08:00
3.5
08:30
2.9
09:00
3.0
09:30
3.2
10:00
3.1
10:30
3.1
11:00
2.9
11:30
3.2
12:00
Reading missing
12:30
Reading missing
13:00
3.1
13:30
3.0
14:00
3.4
14:30
3.5
15:00
3.2
15:30
3.3
16:00
3.0
16:30
3.1
17:00
3.4
17:30
3.5
18:00
3.5
18:30
2.9
19:00
3.2
19:30
3.4
20:00
2.9
20:30
3.1
21:00
3.4
21:30
3.3
22:00
3.2
22:30
3.5
23:00
3.1
23:30
2.9
AlarmTemperature above 6 °C.
AcknowledgedNight supervisor assigns a door check to maintenance.
ActionMaintenance closes the dock door.
Verified closureSupervisor confirms readings below 6 °C after the action.
Interpret this chart
What changed:Cold room 2 exceeds 6 °C before recovery, with a separate midday reading gap.
Why it matters:The recovery readings support closure of the alarm; the gap remains unknown.
What to check:Check the door action, recovery readings and midday sensor connection.
Next step:Verify closure and restore the missing-reading channel.
Packaging humidity
Select a cell to inspect its day
7 day heatmap (%RH)
Operating band: 40 to 55 %RH
No data
Tap or arrow through a cell to inspect it.
30 Jul 2026 to 5 Aug 2026 · Hourly mean (%RH) · SCALE P5–P953756 %RH
Matrix data
Day
00
01
02
03
04
05
06
07
08
09
10
11
12
13
14
15
16
17
18
19
20
21
22
23
Thu
39
42
44
40
39
43
51
51
50
56
56
55
51
51
51
50
55
52
52
55
51
49
42
42
Fri
39
42
42
38
42
47
50
55
53
53
57
52
50
51
53
50
56
56
54
54
53
52
39
38
Sat
38
36
34
38
38
40
46
48
47
46
47
51
48
51
50
46
45
47
51
48
51
45
37
34
Sun
37
35
36
38
36
38
50
50
51
47
49
50
45
49
45
47
47
50
46
46
50
50
37
35
Mon
42
40
41
43
41
45
54
51
52
52
53
55
51
51
52
52
56
50
50
56
53
52
41
40
Tue
42
42
42
43
40
47
54
55
52
50
54
52
54
52
53
55
53
56
50
51
55
50
41
42
Wed
43
41
42
44
42
42
51
53
54
54
54
56
53
55
50
51
56
51
50
51
52
56
40
40
Hours outside the band
Twelve months (h)
Summer contributes most hours
No data
1 Aug 2025 to 31 Jul 2026 · Twelve completed months
Chart data
Interval
Value (h)
Aug 2025
30
Sep 2025
20
Oct 2025
11
Nov 2025
7.0
Dec 2025
6.0
Jan 2026
6.0
Feb 2026
7.0
Mar 2026
10
Apr 2026
14
May 2026
22
Jun 2026
38
Jul 2026
42
Production at a glance
Sample day · Wed 5 Aug 2026 · Each delta compares its named interval with the same interval yesterday
Compare output with utility intensity
Line 1 outputCases per hour, rolling 1 h384cases/h▲ 3.2%
Factory OEELines 1 to 3, rolling 8 h77%▲ 2.7%
Unplanned downtimeAll lines, today31min▼ 8.8%
Energy per caseRolling 24 h0.65kWh/case▼ 4.4%
Water per caseRolling 24 h2.8L/case▼ 6.7%
First-pass yieldLine 2, this shift96.7%▲ 0.8%
Interpret this chart
What changed:Output and utility intensity differ from their comparison readings.
Why it matters:Each metric uses its own interval, so the deltas cannot be read as one common shift change.
What to check:Check the named lines, time windows and comparison with yesterday.
Next step:Review utility intensity alongside downtime and output.
Factory schematic
Select a train for its integration method
Four utility trains
Trace readings to equipment
No data
Sample day · Wed 5 Aug 2026 · Latest readings · Submetering · Select a train for its integration method
Factory schematic readings
Train
Node
Reading
Unit
Water
City main
104
L/min
Water
Booster P-101
3.2
bar
Water
CIP tank
70
%
Electricity
Main incomer
46
kW
Electricity
MCC-2
12
kW
Electricity
Line 2 drive
5.0
kW
Electricity
Ammonia comp.
22
kW
Natural gas
Gas meter
6.9
Nm³/h
Natural gas
Boiler 1
8.2
bar
Natural gas
Boiler 2
0.0
bar
Natural gas
Steam header
8.1
bar
Compressed air
Compressor 1
76
%
Compressed air
Compressor 2
0
%
Compressed air
Receiver
6.8
bar
Compressed air
Header
6.4
bar
One unified dashboard.
Our platform works with the equipment and systems you already have. Existing meters, PLCs, SCADA historians, production databases and APIs can feed the same dashboard as our sensors, giving your team one place to see operational data.
Your readings come together.
Wireless reaches the far corners.
The edge computer keeps collecting.
LTE uses its own connection.
One dashboard reaches your team.
Alerts reach you by text and email.
Text your factory a question.
Existing metersPulse readings join the dashboard.
Our sensorsRead-only readings travel over 900 MHz (LoRaWAN, Digi XBee and similar).
Legacy sensorsDigitize 4-20 mA and 0-10 V.
PLCs and SCADAWe read your existing tags.
HistoriansStored readings join current measurements.
APIs and databasesYour operational data connects here.
We design, source, configure and install the entire system ourselves. Most sensors are wireless, run for years on a battery and can be installed without stopping production. When you call later, you speak with the same people who installed them.
Our team installs monitoring equipment at your facility.
We connect the meters you already have.
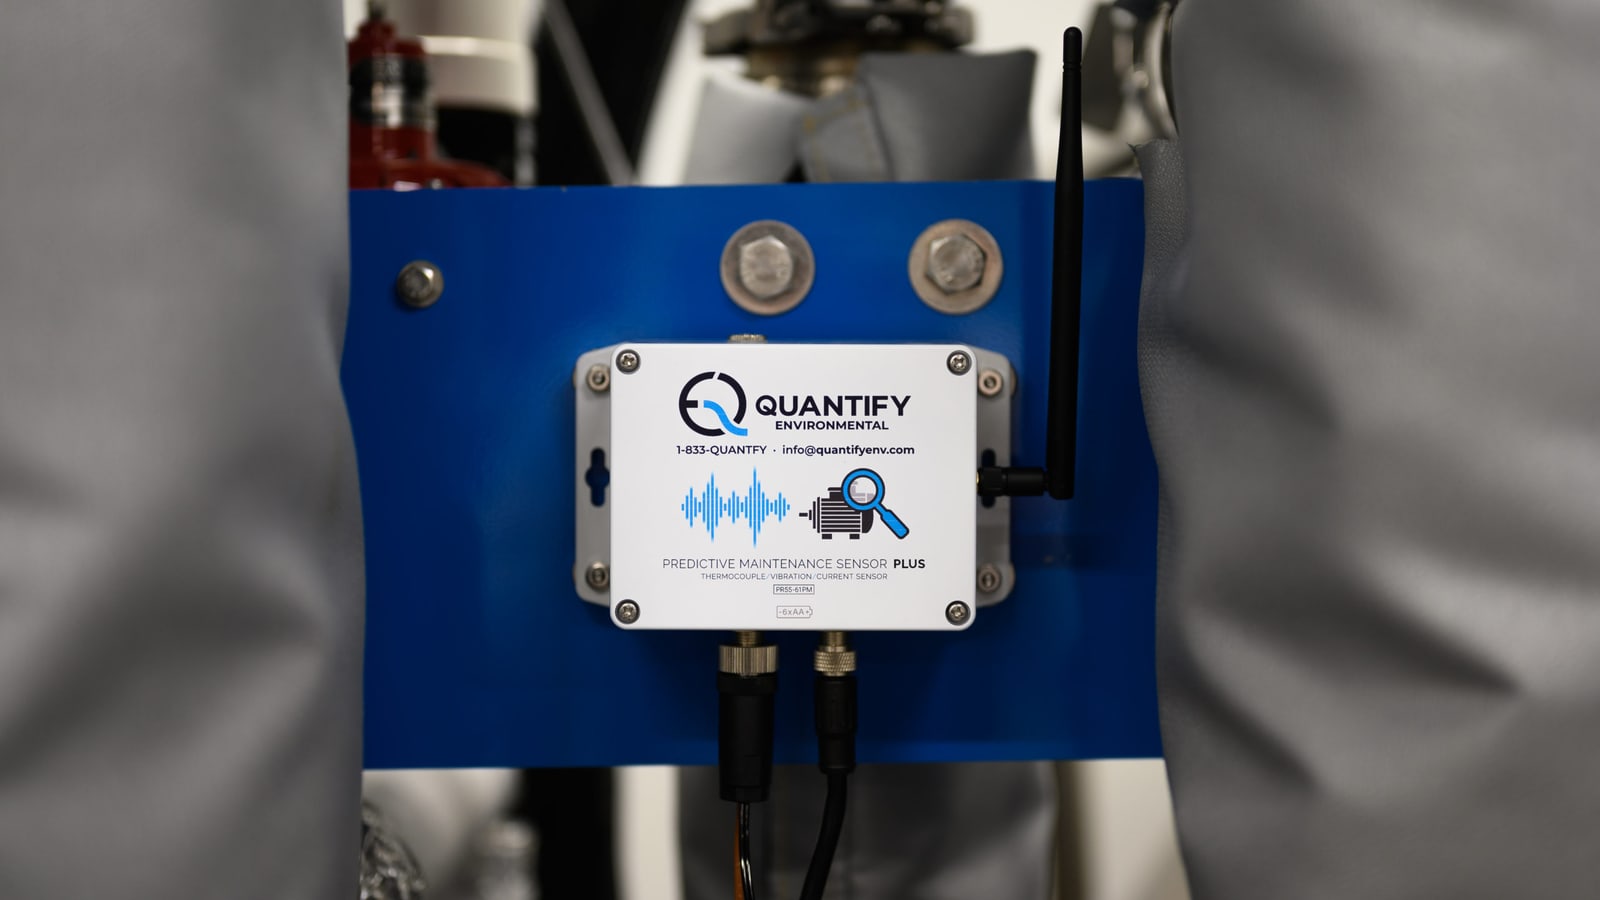
Wireless sensors help your team plan maintenance.
We visit your facility and work with your team.
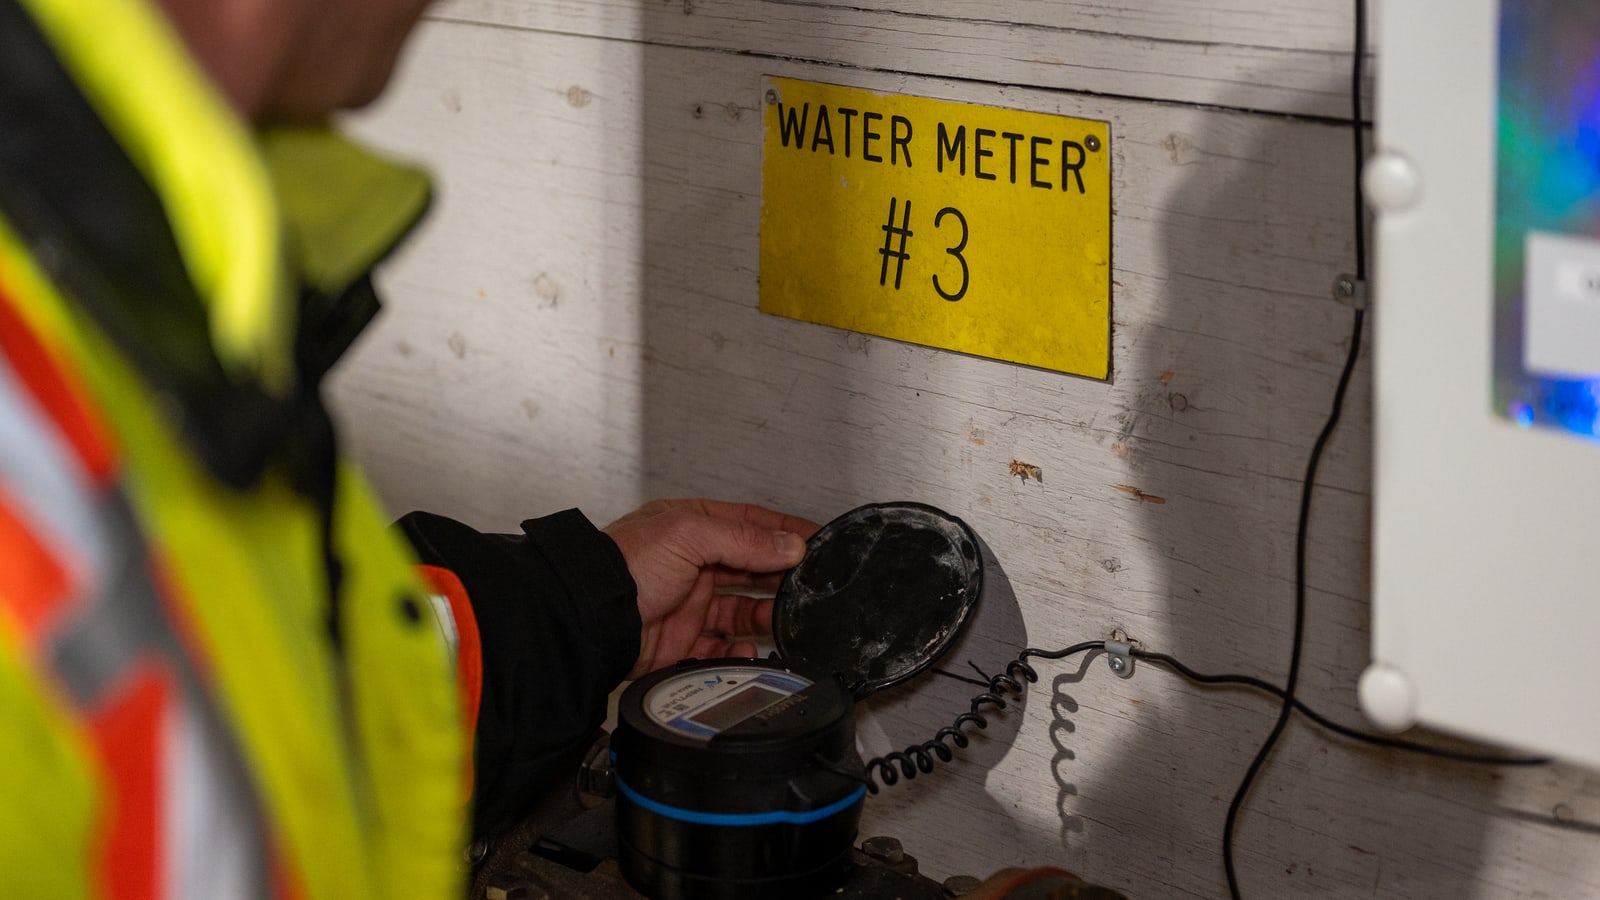
Bring water and flow meter readings into your dashboard.
Built to withstand extreme environments.
900 MHz wireless · LoRaWAN, Digi XBee · through steel and concrete
Two ways our system pays for itself.
01
Production and process visibility
Utilities may start the conversation, but production visibility often creates the bigger opportunity. We monitor silo levels, vibration, product temperature, compressors and cooling towers—information many factories have never had continuously. It is also where predictive maintenance begins: finding a deteriorating bearing early enough to schedule the repair instead of reacting to a breakdown.
02
Utility and overhead reduction
We install permanent meters and sensors on water, electricity, natural gas and compressed air, then convert each reading into cost and GHG emissions. Minute-by-minute monitoring quickly reveals avoidable waste — often caused by schedules, setpoints, or equipment left running. Many of these fixes require little or no capital.
8.3 % of $480,000 a year in electricity, including compressed air. Across 120,000 sq ft.
Annual sensitivity cases, not confidence intervals
Low
$19,000
Central
$40,000
High
$72,000
ExampleReview the assumptions
Energy Management Information System (EMIS) savings inform the energy rates. Bill allocations and savings rates can be edited separately below.
Demand share of the electricity bill Assumption
Bill allocation (%)
Your edited assumption is used in the estimate. The basis and source describe the starting value.
A split of the bill, not a saving. This is the portion of an industrial electricity bill set by the peak kilowatts drawn in a billing period rather than by the kilowatt-hours consumed. It decides which of the two rates below applies to which dollars. It is never applied as a savings rate on its own.
Source for the starting assumption
src/data/benchmarks.json electricity.demandChargeShare, Quantify's own published framing of how much of an industrial electricity bill peak demand sets. The conservative end of that published band is used here.
Compressed air as a share of the electricity bill Assumption
Bill allocation (%)
Your edited assumption is used in the estimate. The basis and source describe the starting value.
Compressed air is an electricity end use, so its spend is carved out of the electricity bill rather than added to it. The share is derived from the leak calculator on this same page: a 100 hp package at 80 % load and 90 % motor efficiency draws 66.3 kW, which over 6,000 hours a year at $0.12/kWh is $47,744 of electricity, or 9.9 % of the example factory's $480,000 electricity bill. Rounded to 10 %.
Source for the starting assumption
Derived from src/lib/calculators/index.js compressedAirLeakCost() using benchmarks.json air.kwPerHp (0.746 kW/hp), air.motorEfficiency (0.90, US DOE Uniform Methods Project Chapter 22), air.compressorHoursTypical (6,000 h/yr) and electricity.blendedRate ($0.12/kWh).
Electricity energy saving Assumption
Savings rate (% of component spend)
Your edited assumption is used in the estimate. The basis and source describe the starting value.
NRCan's own band for a properly implemented Energy Management Information System, applied to the consumption part of the bill only. The low case is the department’s definitional floor, the central case is the figure it calls a reasonable initial approximation, and the high case is the top of the band it reports.
Source for the starting assumption
Natural Resources Canada, "Energy Management Information Systems: Achieving Improved Energy Efficiency" (the EMIS handbook, Office of Energy Efficiency). Section 2.1 sets the definitional floor: an effective EMIS is "one that will reduce energy costs by at least 5 percent". Section 6.4 gives the band: "an EMIS can save 5 to 15 percent of annual energy costs. As an initial approximation, 8 percent appears to be a reasonable estimate." natural-resources.canada.ca/sites/nrcan/files/oee/pdf/publications/industrial/EMIS/EMIS_eng.pdf (retrieved 2026-09-02; see orchestration/research-v5/emis-savings-source.md).
Demand charge reduction Assumption
Savings rate (% of component spend)
Your edited assumption is used in the estimate. The basis and source describe the starting value.
A sensitivity, and it opens at zero. Shaving a billing peak needs load that can actually be moved, and a factory whose peak is set by continuous process load may recover nothing here. Where a peak can be moved, price the measured kilowatts directly with demandSavingsFromKw() instead of using this band: the Alectra Guelph general service 50 to 999 kW demand charge is $11.21/kW-month, so 50 kW off the peak for twelve months is $6,726 a year.
Source for the starting assumption
No published Canadian figure exists for the demand reduction a monitoring programme delivers, so this band is a stated sensitivity rather than a citation. The rate behind the kilowatt form is benchmarks.json electricity.demandChargeRate ($11.21/kW-month, Alectra Utilities Guelph Rate Zone, OEB-approved tariff, Rate Order EB-2025-0055, retrieved 2026-08-25).
Natural gas saving Assumption
Savings rate (% of component spend)
Your edited assumption is used in the estimate. The basis and source describe the starting value.
NRCan's band is stated for annual ENERGY costs, which is the whole utility bill and not electricity alone, so the same three cases are applied to gas. Combustion and heating loads are where the schedule-driven waste an EMIS finds usually sits.
Source for the starting assumption
Natural Resources Canada, "Energy Management Information Systems: Achieving Improved Energy Efficiency" (the EMIS handbook, Office of Energy Efficiency). Section 2.1 sets the definitional floor: an effective EMIS is "one that will reduce energy costs by at least 5 percent". Section 6.4 gives the band: "an EMIS can save 5 to 15 percent of annual energy costs. As an initial approximation, 8 percent appears to be a reasonable estimate." natural-resources.canada.ca/sites/nrcan/files/oee/pdf/publications/industrial/EMIS/EMIS_eng.pdf (retrieved 2026-09-02; see orchestration/research-v5/emis-savings-source.md).
Water and sewer saving Assumption
Savings rate (% of component spend)
Your edited assumption is used in the estimate. The basis and source describe the starting value.
Centred on Quantify's own published average reduction across client sites, which is stated as over 20 %. The low case halves it for a site that has already been through a water programme; the high case is 30 %, which our own installs have passed but which is not the number to plan on.
Source for the starting assumption
src/data/benchmarks.json water.avgReduction, Quantify's own published claim: 'our average reduction rate is >20%'.
Compressed air saving Assumption
Savings rate (% of component spend)
Your edited assumption is used in the estimate. The basis and source describe the starting value.
The published leak share of compressor output is 20 to 30 %, and a leak survey with ultrasonic detection and a fixed repair round recovers most of it. The central case takes the conservative end of the published band, the low case halves it for a site with an active leak programme, and the high case is the top of the band.
Source for the starting assumption
src/data/benchmarks.json air.leakShare, US DOE and Compressed Air Challenge leakage studies as cited in Quantify's own concept footnote.
Utilities and governments may fund part of an energy, water or monitoring project. We help your team identify relevant programs, connect with the right agencies and prepare the information needed to apply. Here are three current opportunities for Canadian manufacturers.
AmountManufacturing: $0.30/m³ of annual gas saved for the first 50,000 m³, then $0.20/m³; capped at 75% of incremental project costs to a maximum of $250,000 per project
Custom incentives and engineering support for industrial natural-gas efficiency retrofits (boilers, heat recovery, steam systems, process heating and similar projects) paid per cubic metre of gas saved.
IESO (Independent Electricity System Operator), Ontario
AmountUp to 50% of eligible project costs; Custom stream pays $1,800/kW or $0.20/kWh, whichever is higher; Prescriptive industrial EMIS pays $50,000 (facilities up to 400,000 GJ/yr) or $250,000 (above 400,000 GJ/yr); double incentive rates available in electricity-constrained regions (still capped at 50%)
Incentives for electricity-saving upgrades at industrial and commercial facilities (HVAC/chillers, lighting and controls, variable-speed drives, manufacturing equipment and solar PV) via prescriptive (set) and custom (measured-savings) streams. The prescriptive stream also funds installation of an industrial Energy Management Information System (EMIS), i.e. the metering and monitoring layer itself.
Amount10% base rate (up to $2M/year); enhanced 15% rate for expenditures May 15, 2025 – Dec 31, 2029 (up to $3M/year), on up to $20M of eligible expenditures per taxation year. The CCPC credit is refundable; the Expanded OMMITC for non-CCPCs is a 15% NON-refundable credit.
A corporate income tax credit on capital investments in Ontario manufacturing, Class 53/43 machinery and equipment used in manufacturing or processing, and Class 1 buildings used for manufacturing or processing. Refundable for CCPCs; the expanded credit for non-CCPCs is non-refundable.
Ask a question in plain language and get a clear answer based on the same live data shown in your dashboard. TYF turns facility data into a response your team can understand and act on.
Explore AI for manufacturing, including forms, dashboard tools and staff training.
Typical questions you can ask TYF
“What was the water use in my facility last week, day by day?”
This technology offers unprecedented visibility into our operations, making immediate water and steam conservation possible for the first time!
Derek CairneyUtilities Specialist, Carlsberg Canada Inc.Read the Carlsberg case study →Approved for publication, 11 April 2024“
…Within weeks of having the dashboard, I've been able to reduce annualized operating costs more than $150,000 by simply making process adjustments based on the data collected.…
My experience with Dave and his team has been nothing less than a home run. Within weeks of having the dashboard, I've been able to reduce annualized operating costs more than $150,000 by simply making process adjustments based on the data collected. The projects already approved this year based on the dashboard data are expected to reduce annualized operating costs by half a million dollars with minimal capital investment.
“
…With Quantify Environmental's support we saved $50,000/year in water. Throughout our projects, the team at Quantify Environmental was constantly in contact with our internal team, ensuring that everyone was on the same page. Their commitment to empowering our co-op students and the extra efforts in gathering additional data brought forth other operational efficiencies that made for even larger success in our projects. For any organization looking to enhance their environmental management while optimizing costs, I wholeheartedly recommend Quantify Environmental.
Rebecca MossCorporate EHS Manager, CpK Interior Products, GuelphFrom our Google reviewsRead the full quote
Having had the privilege to collaborate with Quantify Environmental on two pivotal projects at CpK Interior Products in Guelph, I can attest to their expertise, dedication, and innovative approach. Their meticulous site-wide water audit and heat exchanger metering project not only adhered to our stipulated budget but was also delivered on time, showcasing their professionalism. What truly set Quantify Environmental apart was their state-of-the-art real-time data system and a bespoke Industrial IoT-driven dashboard tailored for CpK. This cutting-edge technology played a pivotal role in identifying, tracking, and ensuring the seamless implementation of our projects. With Quantify Environmental's support we saved $50,000/year in water. Throughout our projects, the team at Quantify Environmental was constantly in contact with our internal team, ensuring that everyone was on the same page. Their commitment to empowering our co-op students and the extra efforts in gathering additional data brought forth other operational efficiencies that made for even larger success in our projects. For any organization looking to enhance their environmental management while optimizing costs, I wholeheartedly recommend Quantify Environmental.
“
Quantify Environmental gave us unprecedented visibility into our resin silos.…
Yakub Lakha, M.Sc (Eng.), MMPEquipment / Asset Manager, CpK Interior ProductsFrom our Google reviewsRead the full quote
Quantify Environmental gave us unprecedented visibility into our resin silos. What started as a water audit in 2023 has grown into critical infrastructure monitoring across our cooling tower, press heat exchangers, and air compressors. Their alerts have already saved us thousands by catching failed solenoids early. The ongoing expansion support from Quantify Environmental has been fast, seamless and incredibly professional.
Start with a walk around your facility.
We spend an hour on the floor with your team, review your recent utility bills and identify what is worth measuring first — including any funding that may apply.