Platform

The Quantify Environmental platform

Quantify Environmental is an industrial IoT integrator. We install wireless sensors and meters throughout your facility and bring the readings into custom, real-time dashboards. The result is an Energy Management Information System (EMIS) your team can use to manage water, energy, equipment and production from anywhere.

We manage the project from assessment through commissioning and ongoing dashboard support. When licensed trades are required, we coordinate their work to our specification and remain accountable for the complete system. You always have one point of contact.

Our platform is hardware agnostic. If you already have meters, a PLC, a SCADA historian or a production database, we can connect it and bring it into one centralized dashboard.

Book a site visitSee the dashboard

Explore a typical Quantify dashboard.

Skip the dashboard

Example period

The tabs, example period, motion and expand controls need JavaScript. Every panel below is server-rendered and complete for the default range, and without script they simply stack.

Site time America/Toronto · Wed 5 Aug 2026 23:30:00
Readings refresh every 30 s · Last reading Wed 5 Aug 2026 23:30:00

Water main

Flow rate (L/min)

Overnight flow continues

OVERNIGHT FLOORShift startCIP cycle
Sample day · Wed 5 Aug 2026 · 30-minute means
Chart data
IntervalCity main (L/min)
00:0087
00:3085
01:0090
01:3089
02:0089
02:3077
03:0081
03:3090
04:0084
04:3080
05:00129
05:30186
06:00221
06:30224
07:00228
07:30230
08:00227
08:30230
09:00233
09:30220
10:00228
10:30222
11:00229
11:30232
12:00173
12:30173
13:00309
13:30310
14:00311
14:30305
15:00311
15:30242
16:00251
16:30248
17:00241
17:30241
18:00240
18:30240
19:00242
19:30248
20:00250
20:30250
21:00246
21:30237
22:00112
22:30104
23:00114
23:30104
Interpret this chart

What changed: Water continues to flow overnight.

Why it matters: Off-hours demand adds to the daily intake even when the lines are idle.

What to check: Check the cleaning schedule, cooling demand and valve positions.

Next step: Isolate unexplained draws, then compare the overnight floor.
Effluent meter

Daily intake and effluent (m³)

Reconcile intake and effluent

9 Jul 2026 to 5 Aug 2026 · Daily totals · Check meter timing and other outlets
Chart data
IntervalCity main in (m³)Effluent out (m³)
9 Jul 2026282229
10 Jul 2026280218
11 Jul 2026215170
12 Jul 2026160127
13 Jul 2026280224
14 Jul 2026282225
15 Jul 2026282225
16 Jul 2026282222
17 Jul 2026280223
18 Jul 2026214175
19 Jul 2026160125
20 Jul 2026278217
21 Jul 2026282223
22 Jul 2026282228
23 Jul 2026281225
24 Jul 2026282224
25 Jul 2026214167
26 Jul 2026159126
27 Jul 2026281229
28 Jul 2026281230
29 Jul 2026279222
30 Jul 2026280227
31 Jul 2026281228
1 Aug 2026215175
2 Aug 2026159126
3 Aug 2026280224
4 Aug 2026281221
5 Aug 2026282226

Hour by day

Select a cell to inspect its day
7 day heatmap (m³)

Afternoon cleaning draws repeat

1 Aug 2026 · 14 · 13 m³00Thu 00: 5 m³Fri 00: 5 m³Sat 00: 5 m³Sun 00: 5 m³Mon 00: 5 m³Tue 00: 5 m³Wed 00: 5 m³01Thu 01: 5 m³Fri 01: 5 m³Sat 01: 5 m³Sun 01: 5 m³Mon 01: 5 m³Tue 01: 5 m³Wed 01: 5 m³02Thu 02: 5 m³Fri 02: 5 m³Sat 02: 5 m³Sun 02: 5 m³Mon 02: 5 m³Tue 02: 5 m³Wed 02: 5 m³03Thu 03: 5 m³Fri 03: 5 m³Sat 03: 5 m³Sun 03: 5 m³Mon 03: 5 m³Tue 03: 5 m³Wed 03: 5 m³04Thu 04: 5 m³Fri 04: 5 m³Sat 04: 5 m³Sun 04: 5 m³Mon 04: 5 m³Tue 04: 5 m³Wed 04: 5 m³05Thu 05: 9 m³Fri 05: 10 m³Sat 05: 8 m³Sun 05: 6 m³Mon 05: 10 m³Tue 05: 10 m³Wed 05: 9 m³06Thu 06: 13 m³Fri 06: 14 m³Sat 06: 10 m³Sun 06: 7 m³Mon 06: 13 m³Tue 06: 14 m³Wed 06: 13 m³07Thu 07: 14 m³Fri 07: 14 m³Sat 07: 10 m³Sun 07: 7 m³Mon 07: 14 m³Tue 07: 14 m³Wed 07: 14 m³08Thu 08: 14 m³Fri 08: 14 m³Sat 08: 10 m³Sun 08: 7 m³Mon 08: 14 m³Tue 08: 14 m³Wed 08: 14 m³09Thu 09: 13 m³Fri 09: 14 m³Sat 09: 10 m³Sun 09: 7 m³Mon 09: 14 m³Tue 09: 14 m³Wed 09: 14 m³10Thu 10: 14 m³Fri 10: 14 m³Sat 10: 10 m³Sun 10: 7 m³Mon 10: 14 m³Tue 10: 14 m³Wed 10: 13 m³11Thu 11: 14 m³Fri 11: 14 m³Sat 11: 10 m³Sun 11: 7 m³Mon 11: 14 m³Tue 11: 13 m³Wed 11: 14 m³12Thu 12: 10 m³Fri 12: 10 m³Sat 12: 8 m³Sun 12: 6 m³Mon 12: 10 m³Tue 12: 11 m³Wed 12: 10 m³13Thu 13: 18 m³Fri 13: 18 m³Sat 13: 13 m³Sun 13: 8 m³Mon 13: 19 m³Tue 13: 18 m³Wed 13: 19 m³14Thu 14: 19 m³Fri 14: 18 m³Sat 14: 13 m³Sun 14: 8 m³Mon 14: 19 m³Tue 14: 18 m³Wed 14: 18 m³15Thu 15: 17 m³Fri 15: 16 m³Sat 15: 12 m³Sun 15: 8 m³Mon 15: 16 m³Tue 15: 16 m³Wed 15: 17 m³16Thu 16: 14 m³Fri 16: 14 m³Sat 16: 11 m³Sun 16: 7 m³Mon 16: 14 m³Tue 16: 15 m³Wed 16: 15 m³17Thu 17: 14 m³Fri 17: 15 m³Sat 17: 11 m³Sun 17: 7 m³Mon 17: 15 m³Tue 17: 15 m³Wed 17: 14 m³18Thu 18: 14 m³Fri 18: 15 m³Sat 18: 11 m³Sun 18: 7 m³Mon 18: 15 m³Tue 18: 15 m³Wed 18: 14 m³19Thu 19: 14 m³Fri 19: 14 m³Sat 19: 11 m³Sun 19: 7 m³Mon 19: 14 m³Tue 19: 15 m³Wed 19: 15 m³20Thu 20: 15 m³Fri 20: 15 m³Sat 20: 11 m³Sun 20: 7 m³Mon 20: 14 m³Tue 20: 15 m³Wed 20: 15 m³21Thu 21: 14 m³Fri 21: 14 m³Sat 21: 11 m³Sun 21: 7 m³Mon 21: 15 m³Tue 21: 15 m³Wed 21: 14 m³22Thu 22: 7 m³Fri 22: 7 m³Sat 22: 6 m³Sun 22: 5 m³Mon 22: 6 m³Tue 22: 6 m³Wed 22: 6 m³23Thu 23: 6 m³Fri 23: 7 m³Sat 23: 6 m³Sun 23: 5 m³Mon 23: 6 m³Tue 23: 7 m³Wed 23: 7 m³

Tap or arrow through a cell to inspect it.

30 Jul 2026 to 5 Aug 2026 · Hourly totals (m³) · SCALE P5–P955.018 m³
Matrix data
Day000102030405060708091011121314151617181920212223
Thu5555591314141314141018191714141414151476
Fri55555101414141414141018181614151514151477
Sat555558101010101010813131211111111111166
Sun555556777777688877777755
Mon55555101314141414141019191614151514141566
Tue55555101414141414131118181615151515151567
Wed5555591314141413141019181715141415151467

Daily use

Daily consumption (m³)

Base load remains on weekends

30-DAY AVG7 Jul 2026: 281 m³8 Jul 2026: 280 m³9 Jul 2026: 282 m³10 Jul 2026: 280 m³11 Jul 2026: 215 m³12 Jul 2026: 160 m³13 Jul 2026: 280 m³14 Jul 2026: 282 m³15 Jul 2026: 282 m³16 Jul 2026: 282 m³17 Jul 2026: 280 m³18 Jul 2026: 214 m³19 Jul 2026: 160 m³20 Jul 2026: 278 m³21 Jul 2026: 282 m³22 Jul 2026: 282 m³23 Jul 2026: 281 m³24 Jul 2026: 282 m³25 Jul 2026: 214 m³26 Jul 2026: 159 m³27 Jul 2026: 281 m³28 Jul 2026: 281 m³29 Jul 2026: 279 m³30 Jul 2026: 280 m³31 Jul 2026: 281 m³1 Aug 2026: 215 m³2 Aug 2026: 159 m³3 Aug 2026: 280 m³4 Aug 2026: 281 m³5 Aug 2026: 282 m³
7 Jul 2026 to 5 Aug 2026 · Daily totals
Chart data
IntervalValue (m³)
7 Jul 2026281
8 Jul 2026280
9 Jul 2026282
10 Jul 2026280
11 Jul 2026215
12 Jul 2026160
13 Jul 2026280
14 Jul 2026282
15 Jul 2026282
16 Jul 2026282
17 Jul 2026280
18 Jul 2026214
19 Jul 2026160
20 Jul 2026278
21 Jul 2026282
22 Jul 2026282
23 Jul 2026281
24 Jul 2026282
25 Jul 2026214
26 Jul 2026159
27 Jul 2026281
28 Jul 2026281
29 Jul 2026279
30 Jul 2026280
31 Jul 2026281
1 Aug 2026215
2 Aug 2026159
3 Aug 2026280
4 Aug 2026281
5 Aug 2026282

Sankey diagram

Sources to end uses (L/min)

Unaccounted: 16 L/min

municipal to cip, 69 L/minmunicipal to pasteurizer, 44 L/minmunicipal to washdown, 34 L/minwell to boiler, 33 L/minmunicipal to tower, 32 L/minrecovered to cip, 26 L/minwell to tower, 22 L/minmunicipal to unaccounted, 16 L/minrecovered to washdown, 13 L/minCity main196 L/minWell W-255 L/minRecovered CIP rinse38 L/minCIP · Lines 1 to 395 L/minCooling tower makeup54 L/minSanitation washdown47 L/minPasteurizer44 L/minBoiler feed33 L/minUnaccounted16 L/minCity main to CIP · Lines 1 to 3: 69 L/min, 24% of total flowCity main to Pasteurizer: 44 L/min, 15% of total flowCity main to Sanitation washdown: 34 L/min, 12% of total flowWell W-2 to Boiler feed: 33 L/min, 11% of total flowCity main to Cooling tower makeup: 32 L/min, 11% of total flowRecovered CIP rinse to CIP · Lines 1 to 3: 26 L/min, 9% of total flowWell W-2 to Cooling tower makeup: 22 L/min, 8% of total flowCity main to Unaccounted: 16 L/min, 5% of total flowRecovered CIP rinse to Sanitation washdown: 13 L/min, 4% of total flowCity main196 L/min68% of totalWell W-255 L/min19% of totalCIP rinse38 L/min13% of totalCIP95 L/min33% of totalCooling54 L/min19% of totalWashdown47 L/min16% of totalPasteurizer44 L/min15% of totalBoiler feed33 L/min11% of totalUnaccounted16 L/min5% of total
Sample day · Wed 5 Aug 2026 · Mean flow (L/min) · Shares of total source flow
Flow data
FromToValue (L/min)
City mainCIP · Lines 1 to 369
City mainPasteurizer44
City mainSanitation washdown34
Well W-2Boiler feed33
City mainCooling tower makeup32
Recovered CIP rinseCIP · Lines 1 to 326
Well W-2Cooling tower makeup22
City mainUnaccounted16
Recovered CIP rinseSanitation washdown13

One unified dashboard.

Bring existing meters, PLCs, SCADA systems and historians into the same dashboard as our sensors. Your data is logged continuously, remains yours, and supports the analytics your team uses to find changes and opportunities.

Technology & hardware

Wireless sensors, built for the factory floor.

Industrial monitoring starts at the asset. Our sensors observe the equipment without controlling it or changing how it operates.

  • Wireless
  • Battery-powered, and they run for years on one long-life cell
  • Industrial-grade
  • Read-only, so nothing we install can change how your factory runs

No manufacturer makes the best sensor for every application. We select the right instrument for each measurement — flow, current, temperature, pressure, vibration or level — and connect it to the most appropriate gateway and network for your site.

We use 900 MHz long-range wireless (LoRaWAN, Digi XBee and similar) to connect sensors to the site gateway.

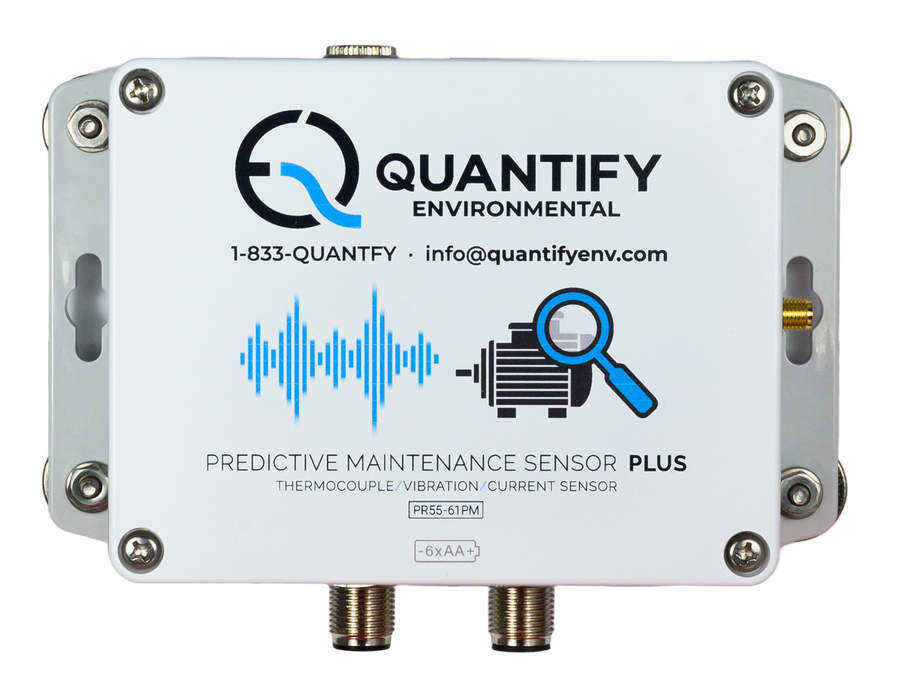
The Quantify Predictive Maintenance Sensor Plus: a white enclosure with thermocouple, vibration and current inputs
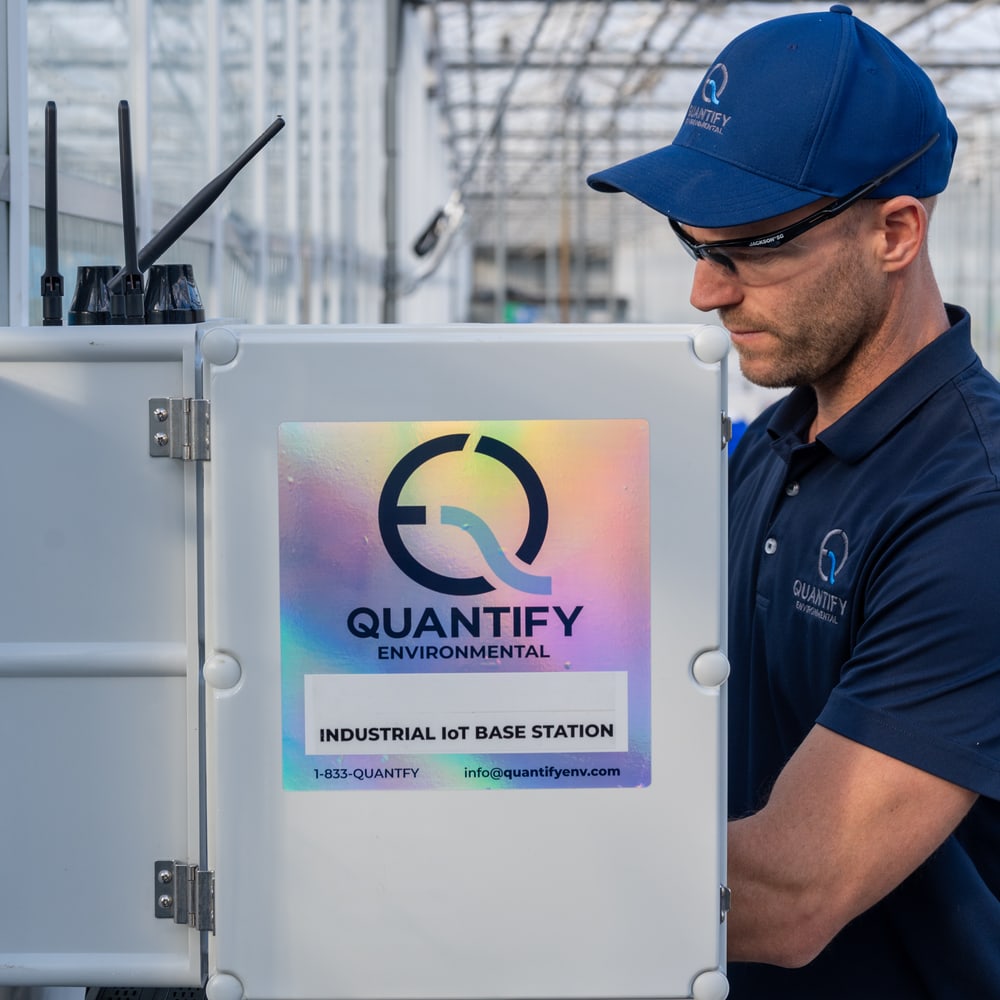
Dave Fox at an open Quantify base station enclosure in a greenhouse

The roster

What can we measure?

If it flows, moves, burns, fills, drains, heats, spins or cycles, we can probably measure it. We also combine related signals — for example, compressed-air flow, pressure and compressor runtime — because a single reading rarely tells the whole story.

The filter needs JavaScript. Everything we measure is listed below either way.

013

Energy and power

Break the bill down by the loads you can change.

  • Electricity, mains and sub-usersThe incomer and the loads under it, permanently metered.
  • Current drawClamp-on transformers on the feeds that matter.
  • Demand peaks and load profileWhere the peak lands, and what set it.

025

Water, gas and compressed air

Every utility stream on the main and on each sub-user, compressed-air monitoring included.

  • Water and liquid flowMains and sub-users, litre by litre, non-invasive where it can be.
  • Natural gasMains and sub-users, so a boiler stops hiding inside the site total.
  • Compressed airFlow and pressure, which is how leak load becomes a number.
  • Propane tank monitoringLevel and draw-down on the tank, with a reorder threshold.
  • The meters you already havePulse output, Modbus or an existing PLC tag, read as-is.

037

Process and operations

Continuous production data many factories have never captured.

  • PressureLine, header and vessel, continuously rather than on a round.
  • Tank and silo levelNon-contact level with a low-level alert. Nobody climbs anything.
  • TemperatureProduct, ambient and asset, with NIST-certified probes where the record matters.
  • Runtime, cycles and ratesHow long it ran, how many it made, how hard it was firing.
  • Water detectionFlood protection under tanks, in pits and around the electrical room.
  • Soil moistureFor growers and grounds, on the same dashboard as everything else.
  • LightAmbient light levels, indoors or in a growing environment.

048

Air quality

What the people on the floor are breathing, logged.

  • Air temperatureRoom by room, cooler by cooler.
  • Relative humidityDry stores, coolers, packaging halls.
  • Particulate matter (PM2.5)Dust and fine particulate, continuously.
  • Carbon dioxideVentilation, fermentation and confined spaces.
  • Carbon monoxideFired equipment and forklift traffic.
  • Hydrogen sulfideWastewater and digester environments.
  • Air pressureRoom differential, so a clean space stays positive.
  • Air velocityDuct and hood velocity where extraction matters.

056

Water quality

What is in the water going out, not just how much of it.

  • pHEffluent, process water and CIP returns.
  • Total suspended solidsThe number a wastewater surcharge is usually priced on.
  • Electrical conductivityDissolved salts, and a cheap early warning on a process upset.
  • Dissolved oxygenAeration control and treatment performance.
  • Oxidation reduction potentialDisinfection and treatment chemistry, live.
  • Water temperatureIncoming, process and discharge.

065

Predictive maintenance

Equipment often shows signs of deterioration before it fails. Continuous monitoring helps your team see those changes early.

  • Vibration, three axisMotors, pumps, fans and gearboxes, trended against their own baseline.
  • Bearing and casing temperatureThe other half of the same story, on the same asset.
  • Motor currentDraw over time, which moves before a failure does.
  • Acoustic and ultrasonicAirborne ultrasound on bearings, valves, steam traps and compressed-air lines.
  • Structural movementLinear displacement on frames, racking and structures.

076

Asset monitoring

Where it is, whether it moved, whether somebody opened it.

  • Motion and occupancyRooms, cells and restricted areas.
  • Proximity and rangingDistance to a target, continuously.
  • AccelerometersShock and movement on things that should not move.
  • GPS locationTrailers, totes and equipment that leaves the yard.
  • Open and closedDoors, gates, hatches and panels.
  • Button triggersA person on the floor logging an event by hand.

085

Analog signals and integration

If it already puts out a signal, we can read it and carry its telemetry with everything else. We do not rip things out.

  • 4-20 mA current loopThe workhorse output on legacy instruments.
  • 0-10 VVoltage output from controllers and sensors.
  • Pulse output and pulse frequencyUtility meters that already count.
  • Dry contactRun, fault and status contacts on existing gear.
  • Modbus and existing PLC tagsRead-only, off the tag your controls team already trusts.

Bring your facility data online — one practical measurement at a time.

It starts with a walk around your floor. A few hours with your team, then an honest read on where industrial IoT monitoring is worth starting, what the return looks like and whether funding is available.

Book a site visitSee the case studies

or call 1-833-QUANTFY (1-833-782-6839)