
Case study
A failing diaphragm pump, caught before it failed
Predictive maintenanceWaterBreweries & Beverage
A transfer line's flow signature drifted, the alert fired, and the diaphragm was replaced on a schedule instead of during a shutdown.
Carlsberg Canada
How it went.
Every study on this site runs the same four beats, in the same order.
01
Alert
Diaphragm pumps degrade before they fail, and the degradation is invisible to the naked eye.
02
Cost
Scheduled replacement. The pump was changed on a planned stop, with no production impact.
03
Fix
Flow monitoring on the transfer line · Baseline and flow-signature tracking in the dashboard · SMS and email alerting on drift off baseline
04
Restored
A scheduled diaphragm replacement, no production impact
In full.
The problem
“Diaphragm pumps don’t fail all at once. They degrade. And when they degrade, the flow signature changes — subtle, gradual, invisible to the naked eye. But not to a sensor.”
What we installed
Flow monitoring on the transfer line, with the baseline and the flow signature tracked continuously in the dashboard, and alerting the moment the trace moved off baseline.
What the data showed
“We saw the pattern change on a Carlsberg transfer line. Flagged it. Maintenance found the diaphragm failing — not failed, failing. They replaced it. Scheduled. Orderly. No production impact.”
What it buys you
“This is what monitoring buys you. Not the repair — the timing.”
A pump that fails in the middle of a run takes the run with it. The same pump, changed on a planned stop three weeks earlier, costs a diaphragm and an hour. Nothing about the repair changed. Only when it happened.
What the data looked like.
Hover or arrow-key across the trace to read any interval. The flagged point is the one that started the conversation.
| Interval | Transfer line (L/min) |
|---|---|
| 00:00 | 12 |
| 00:30 | 117 |
| 01:00 | 119 |
| 01:30 | 11 |
| 02:00 | 11 |
| 02:30 | 118 |
| 03:00 | 118 |
| 03:30 | 12 |
| 04:00 | 13 |
| 04:30 | 120 |
| 05:00 | 116 |
| 05:30 | 14 |
| 06:00 | 13 |
| 06:30 | 115 |
| 07:00 | 114 |
| 07:30 | 12 |
| 08:00 | 15 |
| 08:30 | 112 |
| 09:00 | 110 |
| 09:30 | 16 |
| 10:00 | 18 |
| 10:30 | 107 |
| 11:00 | 107 |
| 11:30 | 18 |
| 12:00 | 18 |
| 12:30 | 104 |
| 13:00 | 104 |
| 13:30 | 19 |
| 14:00 | 19 |
| 14:30 | 100 |
| 15:00 | 98 |
| 15:30 | 21 |
| 16:00 | 21 |
| 16:30 | 96 |
| 17:00 | 95 |
| 17:30 | 25 |
| 18:00 | 24 |
| 18:30 | 91 |
| 19:00 | 90 |
| 19:30 | 27 |
| 20:00 | 28 |
| 20:30 | 88 |
| 21:00 | 85 |
| 21:30 | 28 |
| 22:00 | 29 |
| 22:30 | 84 |
| 23:00 | 83 |
| 23:30 | 30 |
| Before | A flow signature drifting, unnoticed, toward a shutdown |
|---|---|
| After | A scheduled diaphragm replacement, no production impact |
The published totals are the figures in the proof register, with their sources. The interval shape is a representative reconstruction and is flagged as such in the dataset.
What changed.
Before
A flow signature drifting, unnoticed, toward a shutdown
After
A scheduled diaphragm replacement, no production impact
Scheduled
replacement
The pump was changed on a planned stop, with no production impact.
Source: Quantify Environmental monitoring record, reviewed with Carlsberg Canada
Where to go next.
The sector, the sibling studies, and the calculator that runs this same arithmetic on your own numbers.
WaterBreweries & BeverageFood & Beverage Processing
Sub-metering a brewery, and taking more than 100,000 m³ off its water use
Carlsberg Canada
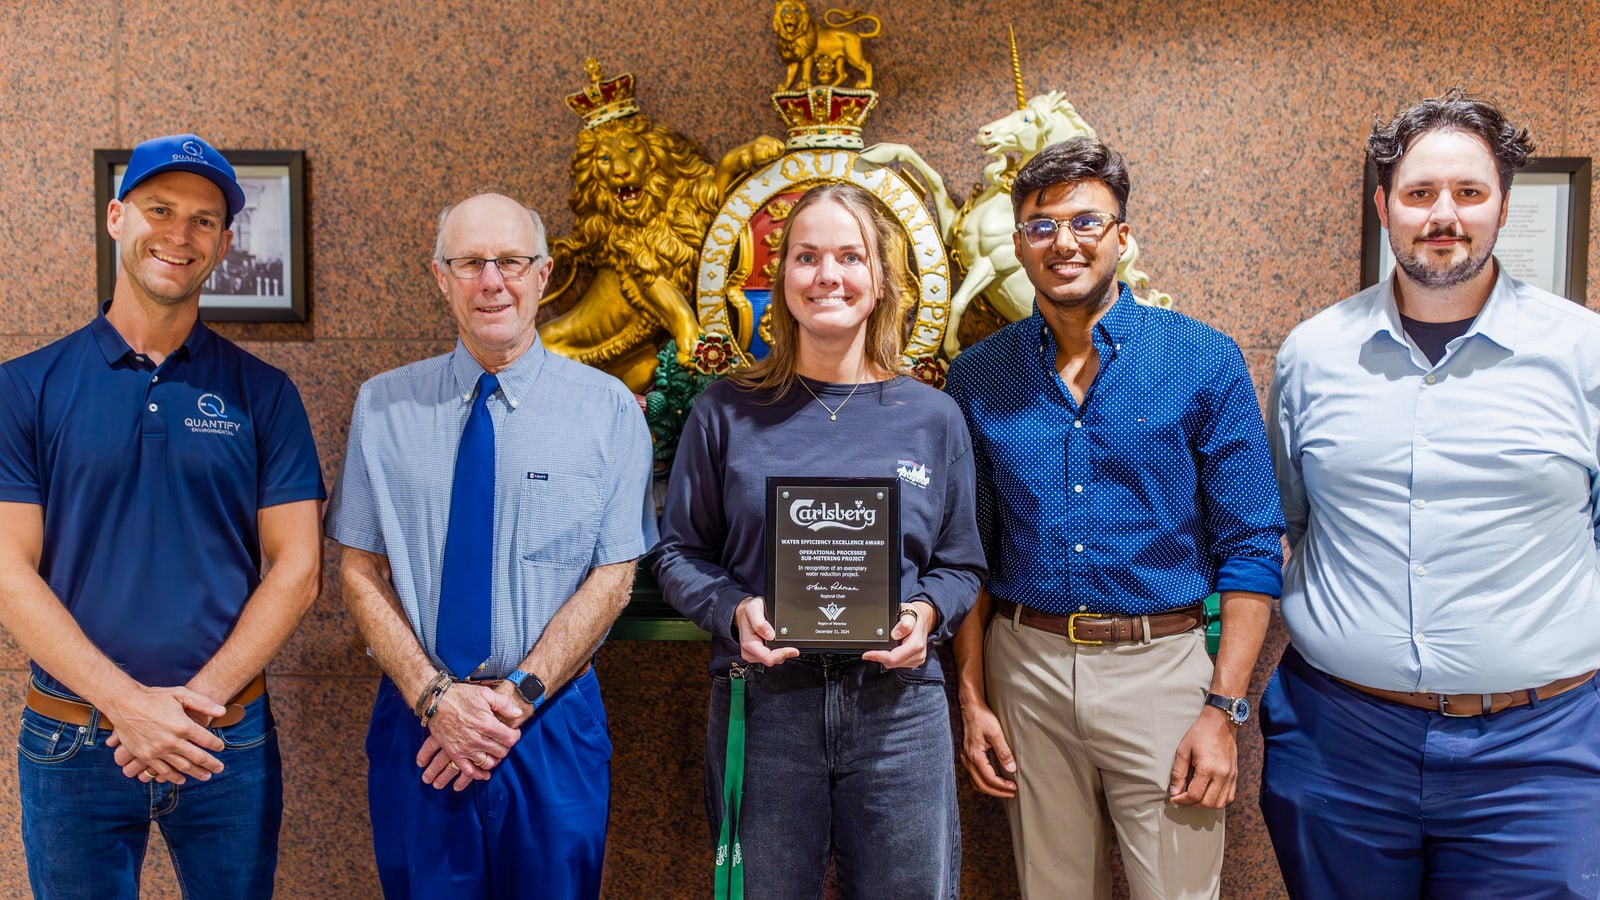
Between 2023 and 2024 water use at the Carlsberg Canada brewery fell by more than 100,000 m³, and the Region of Waterloo gave the site its 2024 Water Efficiency Excellence Award for it.
100,000 m³2023 to 2024
Compressed airWaterFood & Beverage ProcessingBulk Handling & Rail Logistics
More than $150,000 a year, taken out on the dashboard data
PDI Bulk
Metering PDI Bulk's water and compressed air showed where both were going, and within weeks the general manager had taken more than $150,000 a year out of operating costs on process adjustments alone.
$150,000per year
Predictive maintenanceBulk Handling & Rail LogisticsManufacturing: Automotive, Plastics & Rubber
Conveyor-drive bearing degradation detected six weeks before failure
A bulk handling facility
The bearing’s vibration signature began changing approximately six weeks before the projected failure point.
6 weeksof warning
Find out what’s hiding in your factory.
Every study on this site started with somebody walking a floor and asking what the numbers actually were. Our team will do the same on yours and tell you honestly what we find.
Book a site visitAll case studies
or call 1-833-QUANTFY (1-833-782-6839)